
Say it with me: Progressive Policies Are Inflationary

For the past couple of years, I’ve been repeating a phrase on social media: “Say it with me, Progressive Policies are Inflationary. You can argue that all this inflation is worth it, but please show your work.”
Let me elaborate.
Inflation is not a mystery. At its core, it happens when more money chases the same amount of goods and services — or when the fully burdened cost of producing those goods and services rises faster than productivity can offset.
Over the past decade, a broad suite of modern American Progressive policies have both increased the money supply and also increased the fully-burdened cost to produce goods and services.
Those policies include higher tolerance for crime and disorder, enacting much higher-than-market-bearing minimum wages, green energy mandates, expanded deficit spending, student loan forgiveness, universal basic income proposals, government spending outpacing both inflation and population, generous benefits and subsidy for non-citizens, and very large (and usually very poorly tracked) handouts via social programs.
All of these have been championed as tools of economic justice.
You might consider these approaches well-intentioned, but they come at a cost. When we examine them through a rigorous economic lens, a consistent pattern emerges: these policies are structurally inflationary. They decrease affordability, especially on those with lower household incomes. They increase costs, expand the money supply, reduce productive capacity, and/or distort price signals in ways that predictably push prices higher for all.
This is not a partisan attack. It’s simply a description of economic mechanics, and what can be easily observed. Let’s go through the evidence.
Affordability is #1 Voter Concern
Affordability is the dominant issue in American politics, and has been for years.
A Politico poll found that 56% of Americans name the high cost of living as a top issue facing the country, with little partisan divide: 57% of Harris voters and 53% of Trump voters ranked it among their top three concerns.
A PBS News/NPR/Marist poll found that seven in ten Americans say the cost of living in their area is unaffordable — including nearly half of Republicans and three-quarters of independents — and that the price of goods is the single biggest economic concern for Americans, named by 45% of respondents, more than double the number who cited any other issue.
The concern cuts across generations as well. A U.S. News poll found that 70% of young Americans aged 18 to 34 identified inflation and the cost of living as their top issue ahead of the 2024 election — far outpacing the next-closest concerns of abortion access at 40% and gun violence at 31%.
Federally, policies to aggressively expand the money supply are inflationary, as are government spending programs which do not have a commensurate increase in productive output.
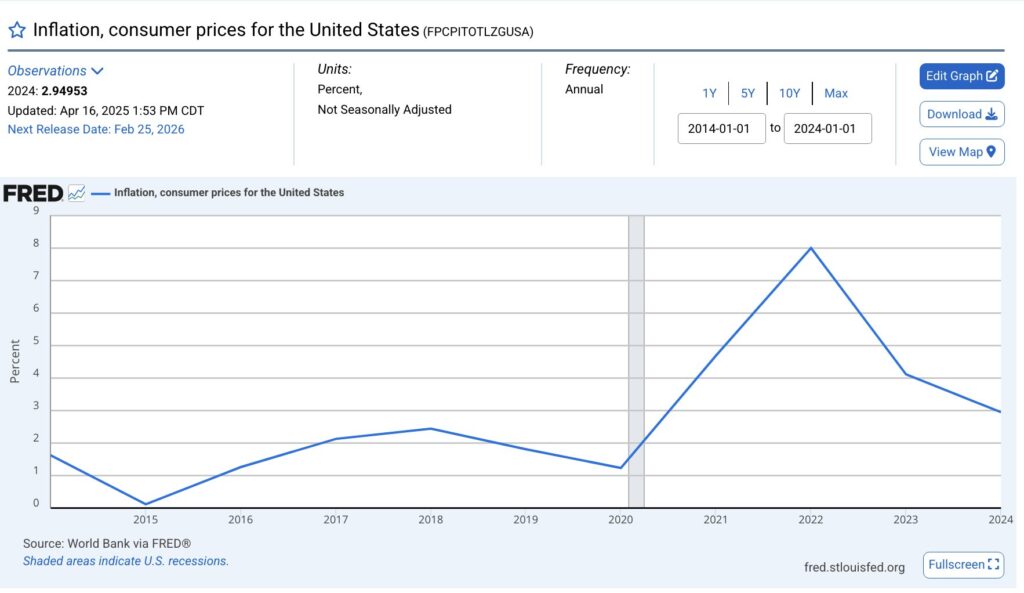
Nationally, consumer price index has risen 26% over the past six years (CNBC), and voters haven’t forgotten it. Politicians of both parties say affordability is their top priority.
During the Biden years, inflation surpassed 8%. It’s now starting to come down, but pressures still remain in deep Blue cities and states.
The question Progressives consistently fail to ask is whether their own policy preferences are making affordability worse.
States cannot print their own money, but they can still enact very inflationary policies. They do this through regulatory measures to increase mandates or costs, both direct and indirect.
The More Progressive the State, the Less Affordable It’s Become
Inflation varies significantly across states. Progressive states have seen significantly higher inflation than those who are more to the center or right.
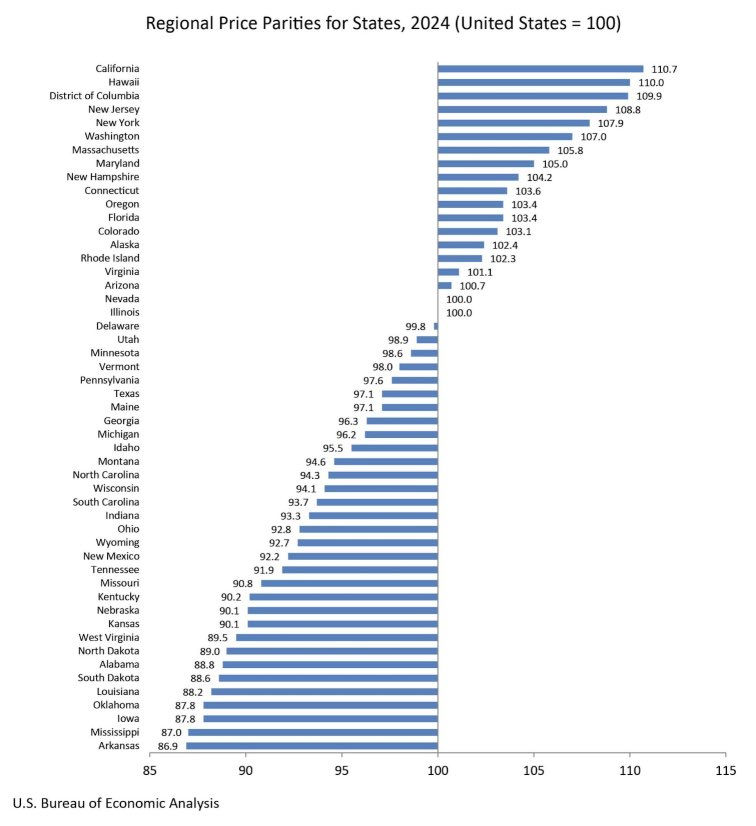
The Bureau of Economic Analysis’s Regional Price Parities data for 2024 offers a striking visual summary of this argument. The chart above ranks every U.S. state by its price level compared to the national average of 100.
The pattern is hard to ignore: the states at the top — California (110.7), Hawaii (110.0), the District of Columbia (109.9), New Jersey (108.8), New York (107.9), and Washington (107.0) — are among the most reliably progressive in the country, with long track records of high minimum wages, aggressive climate mandates, expansive social programs, and rapid government spending growth. The states at the bottom — Arkansas (86.9), Mississippi (87.0), Iowa (87.8), Oklahoma (87.8) — are among the most fiscally conservative. Of course, correlation is not causation; geography, housing density, land costs, and labor markets all contribute to regional price differences. But the consistency of the pattern is notable. When progressives argue that their policies don’t raise the cost of living, this chart asks a pointed question: then why is it most expensive to live exactly where those policies have been implemented most aggressively, and cheapest to live where they haven’t?
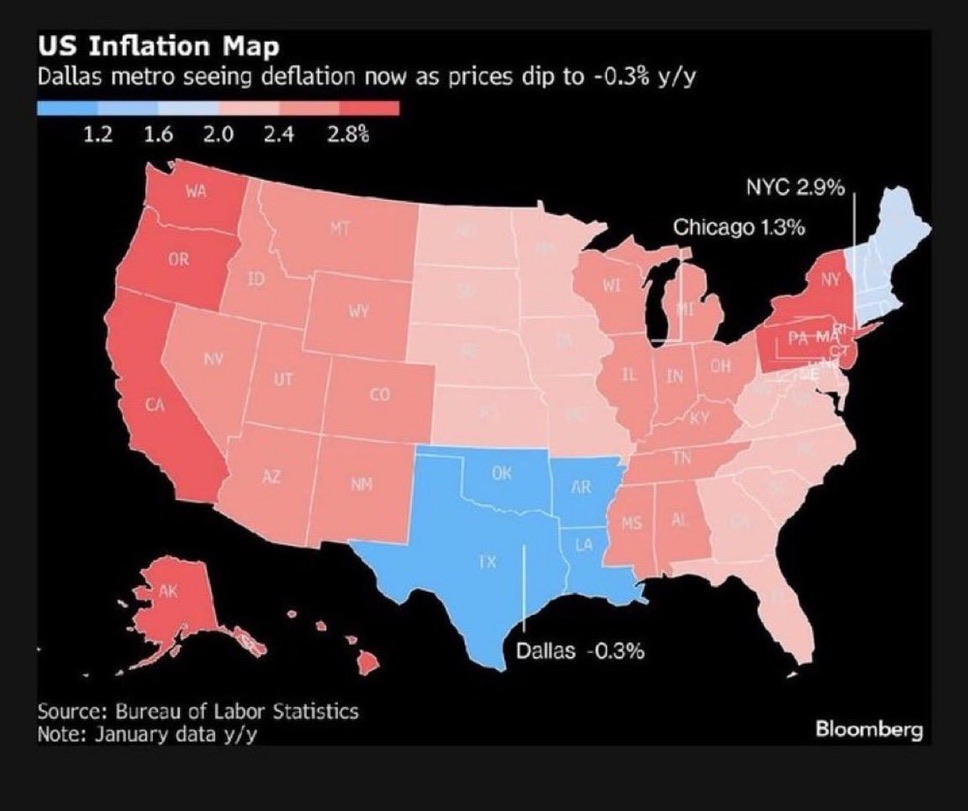
This Bloomberg inflation map above, which uses January 2026 Bureau of Labor Statistics data, puts the regional pattern in sharp relief. The deepest red — the highest current inflation — clusters along the West Coast and the Northeast: Washington, Oregon, California, and New York metro at 2.9%. These are the states that top the Regional Price Parities chart, have the highest minimum wages, the most aggressive climate mandates, and the fastest-growing government budgets. Meanwhile, the blue zone — where prices are actually falling — sits squarely over Texas and its neighbors, with the Dallas metro registering outright deflation at -0.3%. Texas has no state income tax, a comparatively lean regulatory environment, and has added housing supply aggressively. Chicago, often cited as a progressive policy leader among major cities, lands at 1.3% — notably lower than New York’s 2.9%, but still above the deflationary South. No single map proves causation, but this one makes the correlation remarkably hard to dismiss: where progressive policy has been most comprehensively implemented, prices are rising fastest. Where it hasn’t, they’re falling.
The Spending Foundation: More Money, Higher Prices
The most straightforward inflationary mechanism is deficit spending at scale.
When a government spends more than it collects in taxes, it must borrow — or effectively print — the difference. That new money enters the economy as demand without a corresponding increase in supply. The result, all else equal, is upward pressure on prices.
This isn’t just theory. The American Rescue Plan of 2021, a $1.9 trillion stimulus package, is now widely cited by economists across the political spectrum as a contributing factor to the inflation surge that followed. And remember that but for the votes of Sinema and Manchin, the inflationary spending that Progressives championed would have been much, much higher.
Even former Obama administration economist Lawrence Summers warned before its passage that the scale of spending relative to the output gap risked overheating the economy. He was right. U.S. inflation hit a 40-year high of 9.1% in June 2022. The Federal Reserve was forced into the most aggressive rate-hiking cycle since the 1980s to bring it back down — a tightening that raised mortgage rates, slowed business investment, and squeezed household budgets.
That episode was a real-world stress test of the relationship between fiscal expansion and inflation. It did not go well.
Minimum Wage Increases: Good Intentions, Real Cost Effects on All
Raising the minimum wage is one of the most popular Progressive policy proposals. The intuitive appeal is obvious: workers earn more, poverty declines, inequality narrows. But the mechanism by which this happens matters enormously.
When labor costs rise by legislative mandate rather than by productivity or demand gains, businesses face a choice: absorb the higher costs, reduce headcount, or raise prices. Most research finds they do some combination of all three — but the price effect is consistent and measurable.
A study published in the Quarterly Journal of Economics found that restaurant prices rose approximately 0.7% for every 10% increase in the minimum wage. That may sound modest, but it compounds across industries, supply chains, and time. Retail, food service, healthcare, childcare, and logistics all rely heavily on minimum-wage labor, and each sector’s price increases feed into others. A mandated wage floor doesn’t create new wealth — it redistributes costs, often in ways that fall hardest on the lower-income consumers the policy was designed to help, who spend a higher share of income on basic goods.
Green Energy Mandates: The Cost of Acceleration
Transitioning away from fossil fuels is a legitimate long-term goal for reasons that extend well beyond politics. But the pace of that transition matters enormously to near-term price levels.
When government policy restricts or phases out lower-cost energy sources faster than alternatives can scale, energy prices rise. This is not speculation — it is what happened. U.S. natural gas permitting restrictions, limitations on domestic oil production, and aggressive renewable portfolio standards have all contributed to higher energy prices in regulated markets.
Energy is the input cost that underlies all other input costs. When electricity, diesel, and natural gas become more expensive, so does manufacturing, agriculture, transportation, and heating. The inflation that followed the 2021-2022 policy environment was not simply a “supply chain” story — it was in significant part an energy cost story, and energy policy choices played a direct role.
Germany provides a cautionary case study. After accelerating its Energiewende (energy transition) and decommissioning nuclear plants, German electricity prices became among the highest in Europe — and German industrial competitiveness suffered accordingly. The lesson is not that clean energy is bad. It’s that mandating a transition faster than markets and infrastructure can absorb creates price dislocations that hurt ordinary households most.
Seattle’s Gig Worker Progressive Policy Raised Prices, Reduced Overall Revenue
Seattle’s “PayUp” ordinance, which took effect in January 2024, offers one of the clearest real-world illustrations of how progressive labor mandates produce the opposite of their intended effects. The law required app-based delivery companies like DoorDash and Uber Eats to pay drivers a minimum rate per mile and per minute — effectively setting a floor of around $26 per hour. The intent was straightforward: raise pay for some of the city’s most economically vulnerable workers. What followed was a textbook case of unintended consequences. The delivery companies passed the higher costs directly to consumers through added fees, and customers responded by simply ordering less. Within just two weeks of the law taking effect, consumers placed 30,000 fewer orders on DoorDash’s marketplace, and Seattle businesses grappled with a significant decline in revenue. Komo News
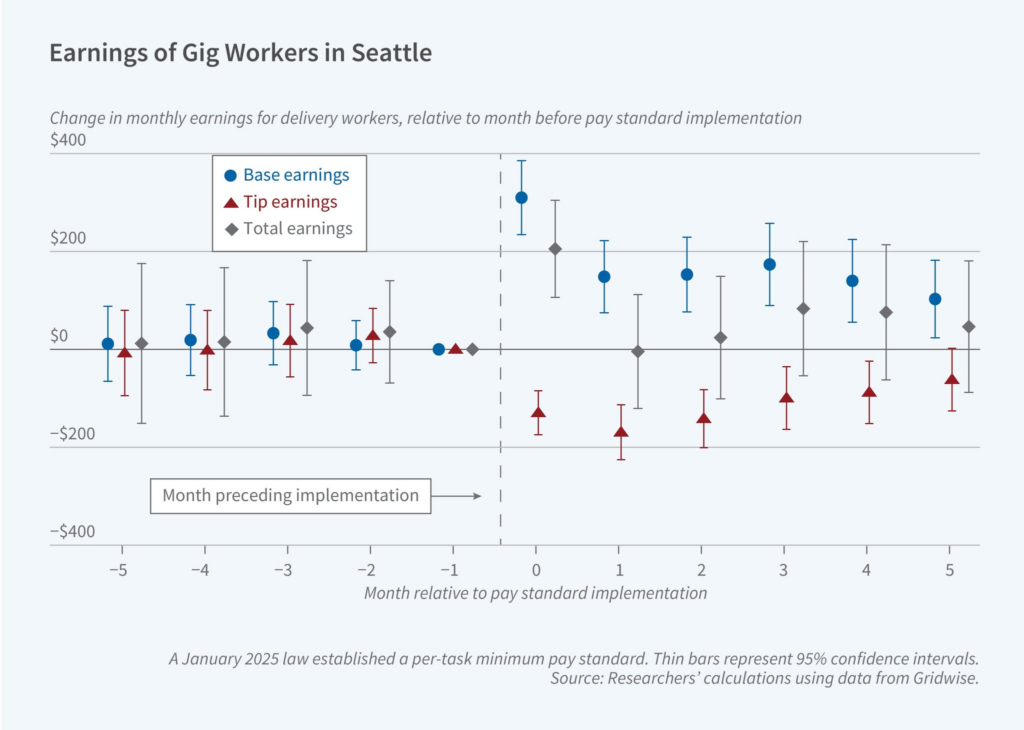
A subsequent National Bureau of Economic Research study, conducted by Carnegie Mellon economists (go Tartans), confirmed the damage: while the ordinance raised per-task base pay, the increases were substantially offset by a reduction in tips and a decline in the total number of tasks completed — leaving the most active drivers with no net increase in monthly earnings. Heinz College
Drivers also faced more unpaid idle time and longer distances between deliveries. Two years in, Seattle became the most expensive delivery market in the country, while Denver and Portland — cities without similar laws — saw delivery revenue grow 20 to 40 percent. Legal Insurrection
The workers the ordinance was designed to help ended up worse off by almost every measurable metric.
Student Loan Forgiveness: Stimulus Without Production
The Biden administration’s student loan forgiveness programs — ultimately constrained by the courts — represented an unconstitutional attempt to transfer hundreds of billions of dollars of debt obligations from borrowers to taxpayers. Setting aside the legal and distributional questions, the macroeconomic effect is straightforward: debt cancellation increases the purchasing power of recipients without producing any corresponding increase in goods or services.
When purchasing power increases without supply increasing, prices rise. Economists estimated that broad student loan forgiveness could have added $300–$500 billion in effective stimulus to the economy. Released at a moment when inflation was already elevated, this would have been, in the words of Jason Furman — another Obama-era economist — the equivalent of “pouring gasoline on an inflationary fire.”
The deeper problem is structural: easy access to federally guaranteed loans has itself been a major driver of tuition inflation for decades. When the government guarantees payment regardless of outcome, universities have little incentive to control costs, and prices have risen accordingly. Forgiveness treats a symptom while the underlying mechanism continues operating.
Universal Basic Income: The Demand-Side Experiment
Universal Basic Income (UBI) proposals vary widely in design, but the common thread is a cash transfer to a broad population of citizens, often funded by deficit spending or new taxes on wealth or income.
The inflationary dynamics depend heavily on how UBI is funded. If financed by deficit spending or money creation, it increases aggregate demand without increasing productive output — the classic inflation trigger. If financed by taxes on income or wealth, it redistributes purchasing power from savers and investors (who might have deployed capital productively) to consumers (who will spend it immediately), potentially increasing short-term demand pressure.
Small-scale pilot programs like those in Stockton, California and parts of Finland produced mixed results. But pilots are not policy. A pilot funded by philanthropic grants in one city tells us little about the macroeconomic effects of a nationwide program funded by the federal government. The aggregate demand effects at scale would be very different — and the inflationary risk correspondingly larger.
Expanded Social Programs: The Supply-Side Constraint Problem
Expanded social programs — universal healthcare, affordable housing subsidies, childcare assistance — address real and serious problems. The inflationary concern, however, lies not in the goals but in the mechanism.
When government subsidizes demand for a service without increasing the supply of that service, prices rise. This is precisely what has happened in housing. Federal and state subsidies for housing assistance have increased demand without a corresponding increase in housing supply (which has been constrained by zoning, permitting, and regulatory barriers — many of which are also products of progressive governance). The result has been rising rents and home prices that outpace income growth, especially in the very cities that have pursued the most aggressive housing assistance programs.
Healthcare tells a similar story. Medicare and Medicaid expand access to care by subsidizing demand. But when the supply of physicians, hospital beds, and specialists is constrained by licensing barriers and workforce limits, more money chasing the same services drives up the prices that the unsubsidized portion of the market pays. Healthcare inflation has run well above general CPI for decades, and the structure of government subsidy programs is a significant contributing factor.
The principle is general: subsidizing demand in markets with constrained supply does not solve the affordability problem — it relocates and often amplifies it.
Washington State: A Case Study in Spending Acceleration
For Washington State residents, this is not an abstract national debate. It is playing out in the state budget with remarkable clarity.
Washington state spent approximately $80 billion in the 2013–15 biennial budget. The 2025–27 budget is projected to spend more than $173 billion — a 116% increase over that period. Over the same timeframe, cumulative U.S. inflation was roughly 36%, and Washington’s population grew about 14%. In other words, spending more than tripled the combined pace of inflation and population growth.
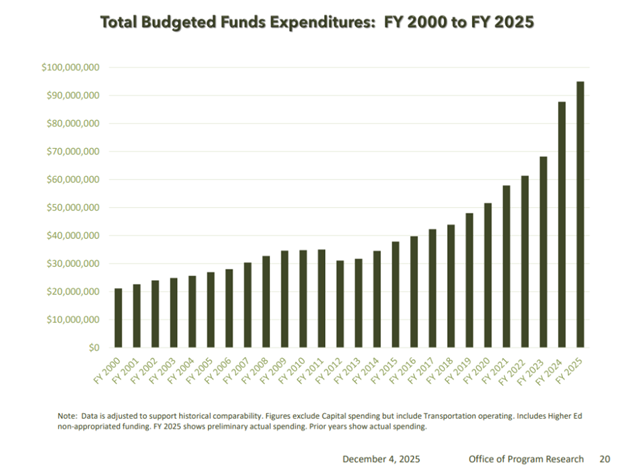
According to the state Office of Financial Management, Washington’s population grew from 7,061,410 to 8,035,700 between 2015 and 2024 — a 13.8% increase. Meanwhile, cumulative inflation since July 2015 was 35.63%, according to the Bureau of Labor Statistics. Total spending grew 116%.
To put those numbers in perspective: if Washington had simply held spending growth to the rate of inflation plus population growth — a reasonable baseline for maintaining the same level of government services per resident — the 2025–27 budget would be closer to $109 billion. Instead, it is $173 billion. That’s roughly $64 billion in spending above the inflation-plus-population baseline — over just one biennial budget.
This spending surge has been funded by tax increases: during the 2025 legislative session, the legislature enacted taxes and fees expected to generate more than $9 billion over the next four years, including an increase in the business and occupation tax rate for most businesses from 1.2% to 1.5%, and an expansion of the retail sales tax base to additional services. These costs are not absorbed by businesses in a vacuum — they are passed through to consumers in the form of higher prices for goods and services throughout the state economy.
Washington has also faced a structural budget problem: enacted appropriations for 2023–25 exceeded revenues expected in the September 2024 forecast by $5.466 billion (8.2%), and appropriating more than forecasted revenues has been a regular legislative practice. Spending beyond forecasted revenues is not a sustainable path — and it puts persistent upward pressure on taxes and prices.
The Counterarguments — and Why They Don’t Fully Hold
To be fair, proponents of Progressive spending make several arguments worth engaging.
First, they argue that government investment in infrastructure, education, and healthcare can increase productive capacity over time, which is disinflationary. This is correct in theory, and there is evidence for it in some areas. The question is whether the scale and composition of actual spending matches this ideal — and the evidence for Washington State and at the federal level suggests a significant portion of increased spending goes to administrative overhead, transfer payments, and interest costs rather than productivity-enhancing investment.
As one big example, check out what’s happening in Public School investment. Tons more total spending, flat to negative (in the case of Washington State, and many other Progressive strongholds) academic outcomes:
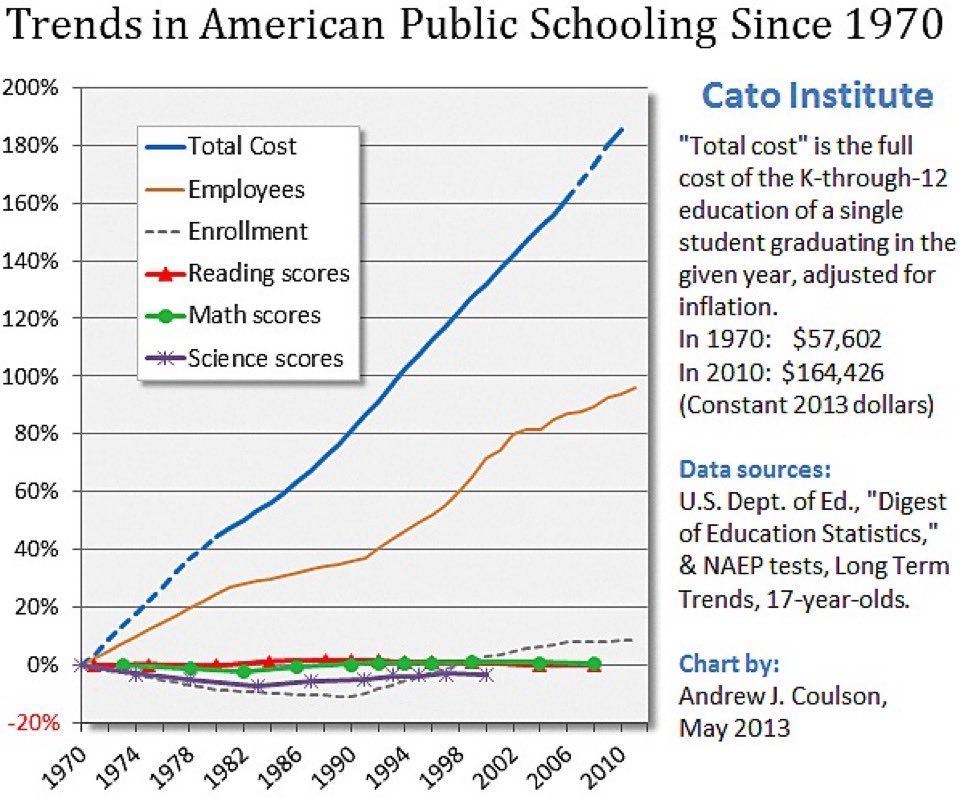
This is not an argument against investment.
But it IS an argument that we are sending good money after bad, and are in desperate need of major restructuring in public education.
Second, Progressives argue that inequality itself is inflationary, and that redistribution corrects a market failure. The academic evidence here is deeply contested. The bulk of empirical research actually runs in the opposite direction — studying how inflation affects inequality rather than the reverse — and consistently finds that high inflation worsens inequality by eroding the purchasing power of wages and savings that lower-income households depend on. Studies that do examine whether inequality causes inflation find contradictory results, with the relationship varying sharply depending on country, time period, and inflation level. The claim that redistribution reduces inflation lacks a well-established causal mechanism, and no serious macroeconomic framework treats it as a reliable policy tool for price stability.
Third, they argue that correlation is not causation — that other factors (COVID supply chain disruptions, energy shocks, corporate profit-taking) drove the post-2020 inflation surge. These factors were real and significant. But the policy response to COVID — in the form of massive deficit spending — was a choice, and economists increasingly agree it contributed materially to the inflationary overshoot.
What Would a Non-Inflationary Progressive Agenda Look Like?
This is actually the more interesting question. If the goal is to reduce inequality, expand access to healthcare, housing, and education, and accelerate the clean energy transition, the question of mechanism matters enormously.
Supply-side reforms — removing zoning barriers to housing construction, expanding medical school capacity, lowering trade barriers on clean energy equipment — can increase access and reduce prices simultaneously. They are politically harder than spending programs but economically more effective.
Make building easier. Make investing easier. Attract investors and (gasp) even wealth-generators.
Revenue-neutral approaches that shift the tax base without increasing the deficit maintain purchasing power without adding aggregate demand. A carbon tax that funds a dividend to lower-income households, for example, can address both climate and equity goals without net inflationary impact.
Wage growth driven by productivity improvements and workforce development is sustainable in ways that mandated wage floors are not. Investing in education and skills training increases worker productivity and thereby justifies higher wages without passing costs forward.
The problem is not that progressive ends are inherently inflationary. It’s that the preferred mechanisms — large-scale deficit spending, mandated cost increases, aggressive green energy regulation, demand subsidies without supply reform — consistently produce inflationary effects as a side consequence.
Conclusion: Progressives correctly note “Affordability” is salient to voters, but they are worsening it with Progressive policies.
Here is the deepest irony in this story: inflation is itself one of the most regressive economic phenomena. It is a tax on all, and hits those with low incomes hardest. It erodes the purchasing power of wages and savings most severely for those with the fewest assets to hedge against it. The people hurt most by a sustained 7% inflation rate are not the wealthy, who hold real assets that appreciate with inflation, but lower- and middle-income households whose paychecks and savings accounts lose ground in real terms.
A policy agenda that aims to help working families, but that produces persistent inflationary pressure, undermines its own stated purpose.
The residents of Washington State who are paying higher taxes, higher rents, and higher prices for everyday goods while state spending has more than doubled the rate of inflation deserve to know that this is not an accident of circumstance. It is the predictable outcome of specific policy choices.
Good intentions are not enough. Economic mechanisms are not optional. And the bill for ignoring them eventually comes due — usually paid by the people least equipped to absorb it.
What if the “affordability crisis” is just… Progressivism?